Standard deviation is one of the most important concepts in statistical analysis. It is used to measure both the center and the spread of a set of data. It is a powerful tool to help measure the influences of outliers on a data set, as well as identify potential clusters or trends within a group of numbers. In this article, we will explore the concept of standard deviation and its importance in understanding the distribution of sample means.
Explaining the Concept of Standard Deviation
Standard deviation is a measure of how widely dispersed the individual data points are from the mean, or average, of all of the values. It is calculated by taking the square root of the average of the squared differences from the mean. This yields a descriptive figure that can be used to compare various datasets, or to look at the spread of data within a single dataset. A low standard deviation indicates that the majority of values are close to the mean, while a high standard deviation indicates that the data points are spread out over a wide range.
Analyzing the Distribution of Sample Means
It is often helpful to analyze the distribution of sample means when analyzing data sets. The sample mean itself is simply the average of a collection of cases, and provides information on central tendency. When the sample means follow a normal distribution, it indicates that there is no skewness bias in the distribution. Knowing where the mean lies in relation to what else lies in the dataset can provide valuable insight when analyzing data.
Calculating the Standard Deviation
Standard deviation is calculated by taking the square root of the average of the squared differences from the mean. This yield a descriptive figure that shows how widely dispersed individual data points from each other. To calculate standard deviation, you must first determine the mean value for the dataset by summing all the observations and dividing it by total number of observations. Then for each observation, you must subtract it from the mean and square it. Once you have done this for all observations, you must sum up the values and divide it by total number of observations. This will give you the variance of your dataset. You can then find the standard deviation by taking the square root of that variance.
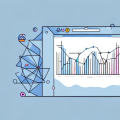
Visualizing the Results of Standard Deviation
The results of standard deviation can be easily visualized on a histogram. Histograms allow us to visualize where most observations lie on an x-axis and y-axis. These points represent the average range of values in a data set. They also shed light on any outliers or patterns within our data set. By plotting these points on a histogram, we can quickly understand how spread out our data is.
Using Standard Deviation to Interpret Data
Standard deviation can also be used to understand more complex data relationships. For example, one could use standard deviation to measure the spread between two different datasets and compare them side-by-side. This could be useful to understand correlations, or to compare various distributions within a broader category. By comparing one dataset over another, it can help to identify any anomalies or unusual trends.
Applications of Standard Deviation in Statistical Analysis
Standard deviation is not just useful for simple visualizations or directly interpreting data. It can also be applied within statistical analysis for more advanced problem solving. For example, it can be used to measure variable associations, baseline risks across different populations, or to measure how well models fit specific datasets. Additionally, it can be used to assess confidence intervals and derive Z-scores.
Comparing Different Distributions Using Standard Deviation
Standard deviation can also be used to compare different distributions in order to determine similarities or differences between them. This is important as it allows us to better understand how each distribution is being affected by any outliers or trends within its own data set, while also offering insights into every comparison across different distributions.
Limitations of Standard Deviation Analysis
Standard deviation is a powerful tool for analyzing data and understanding distributions. However, there are several limitations to standard deviation analysis that must be taken into consideration when using it for statistical analysis. For example, increasing sample sizes will decrease the standard deviation even if there are outliers in the data set, so it is important to take into account any potential outliers before calculating standard deviation. Additionally, it cannot accurately measure connections between non-linear trends in data sets.
Conclusion
The standard deviation of the distribution of sample means is an important concept to understand when analyzing data sets for trends, clusters, broad comparison or any complexities amongst large datasets. It can be used to measure both the center and spread of all values within a dataset, as well as offer insights into comparison between different distributions. However, it must be used carefully and its limitations taken into account as it may not always provide an accurate assessment of complex relationships.